|
Participants
The study includes results
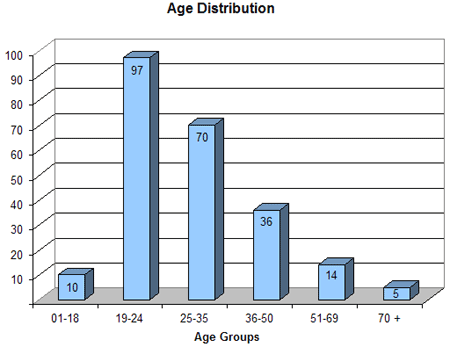
from 232 people from 22 countries. The mean age of this
group is 30.34 with the youngest being 15 and the eldest
being 81. For the purposes of this study, 6 age groups
were
established: 1-18, 19-24, 25-35, 36-50, 51-69, and 70 and
older. Please see figure 3-1 for a graphical representation
of the number of participants in the aforementioned age
groups.

Figure 3.1 - Age Groups
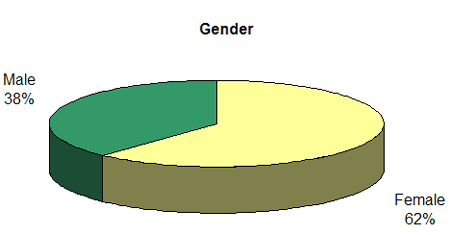
Both sexes were represented in this
study. Females accounted for 144 survey results and males
accounted
for 88. The unequal distribution between the sexes relates
to the procedures for presenting the survey to the public.
(see the “Procedures” section below for more
details)

Figure
3.2 - Gender
The Survey
 |
The survey consists
of 28 questions. The first three ask for geographic,
age,
and gender information. Questions 4-15 ask for color
association information. All the color association questions
require
that the participant associate something to one of the
following colors: Black, Blue, Brown, Green, Grey,
Orange, Purple,
Red, White, or Yellow. The colors were listed in alphabetical
order and included a small example of the colors in
question.
The aforementioned colors are listed in Osgood’s
atlas of affective meaning as colors that carry a high
affective value (Cross-Cultural
Universals of Affective Meaning). Questions 16
and 17 ask the participant to give their favorite and
least
favorite color of the colors listed (same colors as
questions 4-15). And the last set of questions (18-28)
ask the participant
to rate from 1 to 5 the frequency they use (or perform)
one of the listed specific Internet activitites. A score
of
1 correlates to not performing that activity at all and
a score of 5 correlates to performing that activity “all
of the time.”
The Questions included in the Survey:
1. What country best represents
your culture?
2. What is your age?
3. Gender
4. Which do you think best represents something cheap
/ inexpensive?
5. Which color do you think best represents reliability
/ dependability?
6. Which color best represents trust?
7. Which color best represents security?
8. Which color best represents speed?
9. Which color best represents fun?
10. Which color best represents high-quality?
11. Which color best represents high-technology?
12. Which color best represents loneliness / desperation?
13. Which color best represents fear / terror?
14. Which color best represents disease / health problems?
15. Which color best represents courage / bravery?
16. Of the listed colors, which is your favorite?
17. Which is your least favorite color?
Please rate from 1 to 5 the frequency
with which you perform the following activities. 5 is
very often, and 1 means that you don't perform this
activity at all.
Number code:
1 = "Not at all."
2 = "Very rarely"
3 = "Sometimes"
4 = "Often"
5 = "All the time."
18. Shopping
19. Communicate (e-mail, chat, message boards, etc.)
20. Research (work / school)
21. Selling goods (e.g. ebay.com)
22. Get the latest news
23. Get the latest weather report
24. Play games
25. Download and/or listen to music
26. Download and/or watch movies
27. Express yourself (visual art) – (e.g. display
art, photography, etc.)
28. Express yourself (written word) – (e.g. stories,
poetry, etc.)
Pretest
 |
A short pretest took
place from January 24th to January 30th. The web form was
tested in multiple browsers (e.g. Microsoft Internet Explorer
4.0, 5.0, 6.0 (all for Microsoft Windows (version 5.0 for
Mac), Netscape 4.7, 6.x, and 7.x for Microsoft Windows,
Red Hat Linux, Phoenix .5 for Microsoft Windows and Linux
platforms, and Safari Public Beta v60 for Apple computers.
The web form was also tested under multiple submission
conditions. That’s when two people submit results
simultaneously. This was to ensure that the data submitted
would collect without error under moderate traffic. Once
the form was working properly, the questions were presented
to a small group of people. Some minor changes were made
to correct errors and to better word questions (e.g. changing
the first question from “What country are you from?”
to “What country best represents your culture?”).
Because this project began with the intention to compare
and
contrast cultural differences and similarities between
assorted culture groups, the choice to re-word some of
the questions
was necessary. Although the focus of the project changed
(due to the type of results gathered) the results that
were
collected still supplied enough information to examine
other interesting comparisons.
Procedures
Participants learned about the survey
through several forms of online communication and verbal
communication. The majority of the participants learned
of the survey through email campaigns and posts on educational
message boards. The link to the survey was also listed
on multicultural public message boards as well as some
international
(culturally focused) message boards in Germany, Hong Kong,
the Philippines, and Canada. This was an attempt to earn
results from non-US publics. Aside from these online communications,
several phone calls were made to colleagues in different
vocational environments. These verbal advertisements were
made during the last third of the survey’s public
timeline. As stated on the homepage, the goal was to
obtain
500 submissions and once failure of reaching that goal
set in, phone calls were made to help supply enough results
to top out above 200.
|